What is Data Visualization and Why is it Important
We are living in a world of big data. However, big data only makes our lives easier if they are easy to understand. Otherwise, we may mess up the data and, who knows, might come up with bad decisions.
Thus, from personal to professional life, from nonprofit organizations to the biggest business farms, processing, presenting, and understanding data is important. Here is where data visualization can play a huge part.
To make data easy to understand and make appropriate decisions.
We like to explore technology before you. And that’s why we share all about data visualization here in this article.
Are you ready?
What Is Data Visualization
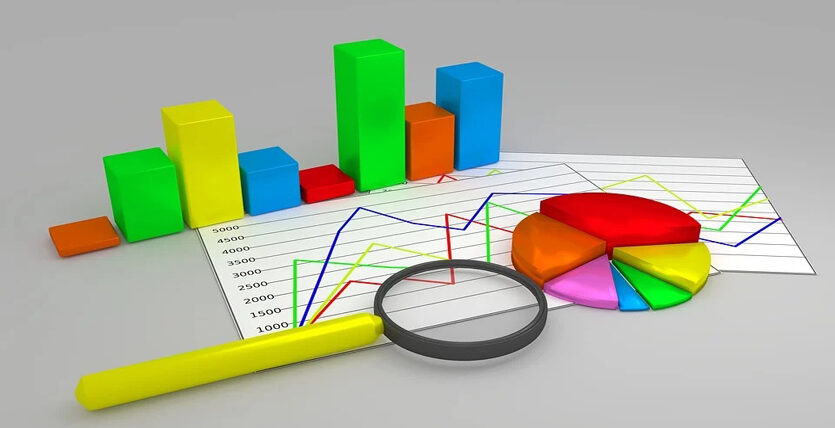
We don’t want to confuse you by telling you complex technological terms. Simply put, data visualizations are all about presenting data in a way that makes it easier for all classes of people to understand.
Here, mediums like tables, charts, graphs, infographics, pie charts, tree maps, heat maps, etc. are used to present data visualization data. This is as simple as you could ever think.
The visualized data is easy to consume. Furthermore, it removes the confusion for the top management people of the organization to make effective decisions having the biggest data on their hands.
If you carefully look around the internet, you will find examples of data visualization almost everywhere.
Do you want to know the weather update? Do you want to know the latest condition of the share market? Then, you will find a visual representation of data out there.
Nevertheless, data visualization can be used for different purposes. For example, do you run an online business? Do you need more control over your business data? The need for data visualization is needless to say. But why?
This leads us to the next part of this blog.
Why Is Data Visualization So Important
Just think about the scenario of what the economic statistics of the current world looks like without proper visualization of data. We know it will be confusing. Or, think about a large business organization, how will the HR manager deal with the productivity data of his employee?
You may have already started to understand the values of data visualizations.
- Idea Generation
Data visualization impressively helps people generate ideas as efficiently as possible. No matter what type of idea. But, this can help business organizations a lot as they need to be more accurate regarding what type of idea they make.
- Market Research
Market research is as important as raising funds to start a business. However, you can only benefit from market research if you have market-related data in your hand.
That’s it? No!
You need to understand data more precisely to get the most out of market research. Here, data visualization can help you on a large scale. With the proper use of advanced software, it is possible to visualize data.
- Easy Information Share
You need to share information with others. Regarding business, it’s important to share data with the responsible authority. However, data visualization makes it easier to share information effectively.
However, it’s important to get started with data visualization. You may never want to lag behind by avoiding proper access to data.


